What is the “East-Japan Soil Becquerel Measurement Project”?
As a result of the Fukushima Daiichi Nuclear Power Plant accident on March 11, 2011, an extensive area of eastern Japan was exposed to radiation.
From 2012 to 2013, a citizen group called “Soil Research Project Iwate” collected soil samples and conducted measurements of radioactive soil contamination from over 300 locations in Iwate Prefecture.
In order to grasp the full extent of soil contamination in eastern Japan, Minna-no Data Site (Everyone’s Data Site) started the “East Japan Soil Becquerel Measurement Project” in the seventeen prefectures in eastern Japan, where the Japanese government was carrying out radiation testing of agricultural produce. Data Site adopted the method used by “Soil Research Project Iwate”, which was to directly measure the amount of radioactive material in becquerels per kilogram (Bq/kg).
From October 2014 to September 2017, over 4,000 citizens collected soil samples from over 3,400 locations with the goal of measuring radioactive cesium in the soil and visually showing these results on a map of eastern Japan.
You can display such a map!
Select "Map Type", "Year" and "Area" below and click search button.
You can also change the "type of map", "year" and "area" from the map page menu.
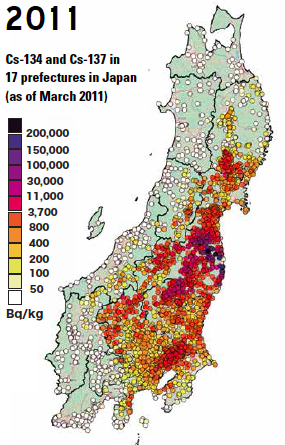
1Map type
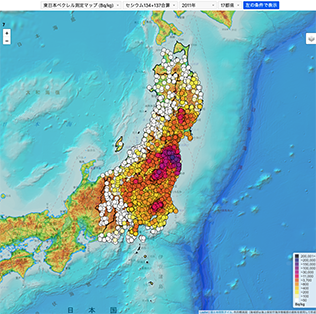
It is a basic map that measures how much radioactivity exists in 1 kg of soil. You can select [Cesium 134 + 137 Total] or [Cesium 137].
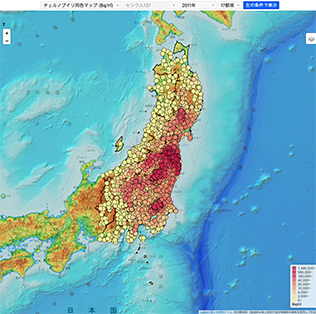
This map has the same color scale as the map of radioactivity made in Russia and Belarus after Chernobyl, so you can compare the radioactivity levels in Fukushima and Chernobyl.
Please see the animation below while comparing the spread of colors in the "forced evacuation zone" and "evacation right zone" (cesium 137 concentration) based on the Chernobyl method and the Japanese soil measurement map expressed in the same color. It can be seen that a high concentration of contaminated area is widely spread from the TEPCO Fukushima Daiichi Nuclear Power Plant.
The maps of Belarus, Ukraine, Russia, etc. which examined the radioactive contamination degree of Chernobyl nuclear accident use the unit of Bq / m2 to see the surface contamination of the soil. (Or MBq / km2, Ci / km2)
For this reason, if you want to compare the map with Chernobyl, you need to match the unit and display only the basic cesium 137 value.
Note: The soil project uses a method of displaying each measurement point, as the collection points are insufficient to indicate contamination on the surface.
2Year
* * The map of 17 prefectures for the July 2020 Olympics is available as a free download for non-commercial use. Find out more
3Prefecture
If you click the name of a prefecture, you can see the list of each prefecture in which the numerical values at the time of measurement are displayed in detail.
East Japan Soil Becquerel Project Radioactive Cesium Contamination Attenuation Estimate 100 years Download the map from here.

100 year map download
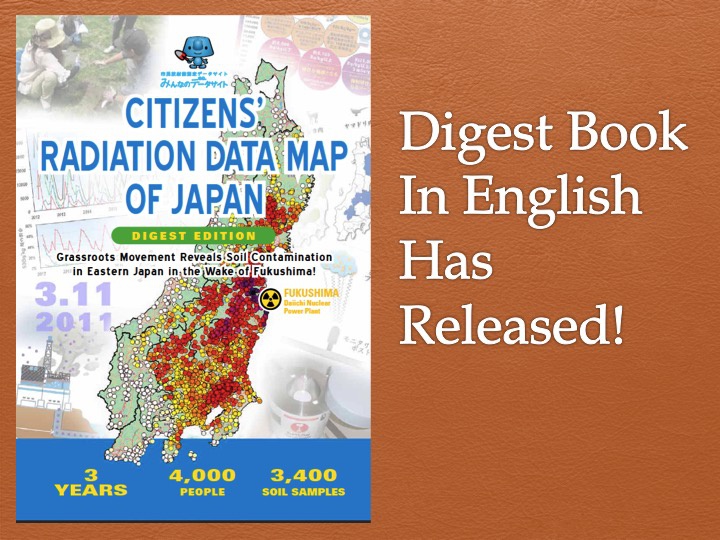
Citizens' Radiation Data Map of Japan-Digest- is aveilable